Odoo 16 Sale Analysis and Reporting
Constant analysis and monitoring of sales activities are essential to take action and accurate decisions for the growth and success of a company. An effective sales analysis can help to scale your business by helping you to get a clear picture of the current status of your business and will also help in predicting what will be in the future. Manually analyzing your sales and business will be a tedious task and also may be prone to some human errors. Thanks to the Odoo report feature of the Sales module, we can easily and effortlessly analyze the sales activities of the company. The reporting feature in Odoo will give you a better understanding of all sales operations on a daily, weekly, monthly, and yearly basis as per your requirement.
The Odoo Sales Analysis Report can be accessed by going through the following steps –
Sales → Reporting

The above Sales reports can be analyzed both quantitatively and qualitatively with the help of different filters or measures available. To generate reports based on various parameters or measures, you can select the required measures or parameters listed under the MEASURES tab. These measures or parameters can be changed as per the requirement.

The various measures included in Odoo Sales Analysis Report are –
- # of Lines
- Discount %
- Discount Amount
- Gross Weight
- Margin
- Quantity Delivered
- Qty Invoiced
- Qty Ordered
- Qty to Invoice
- Qty to Deliver
- Total
- Untaxed Amount Invoiced
- Untaxed Amount To Invoiced
- Untaxed Total
- Volume
- Count
To make the data analysis more user-friendly and customizable, Odoo has facilitated different views for the same. Odoo’s Sale Analysis Reports can be analyzed in graphical, pivotal, or dashboard views by selecting the respective options available.
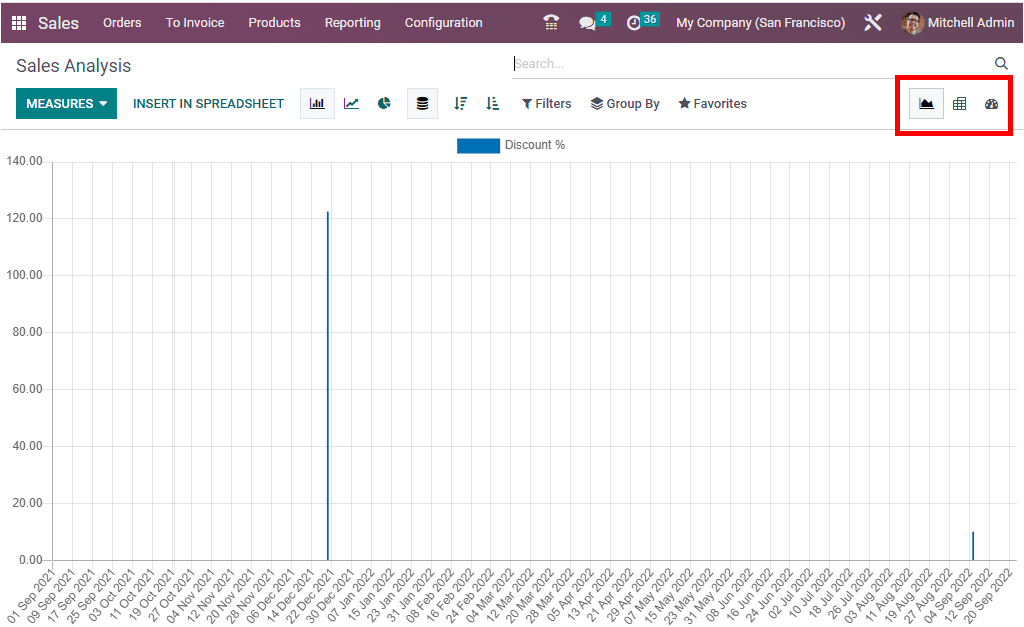
GRAPH VIEW
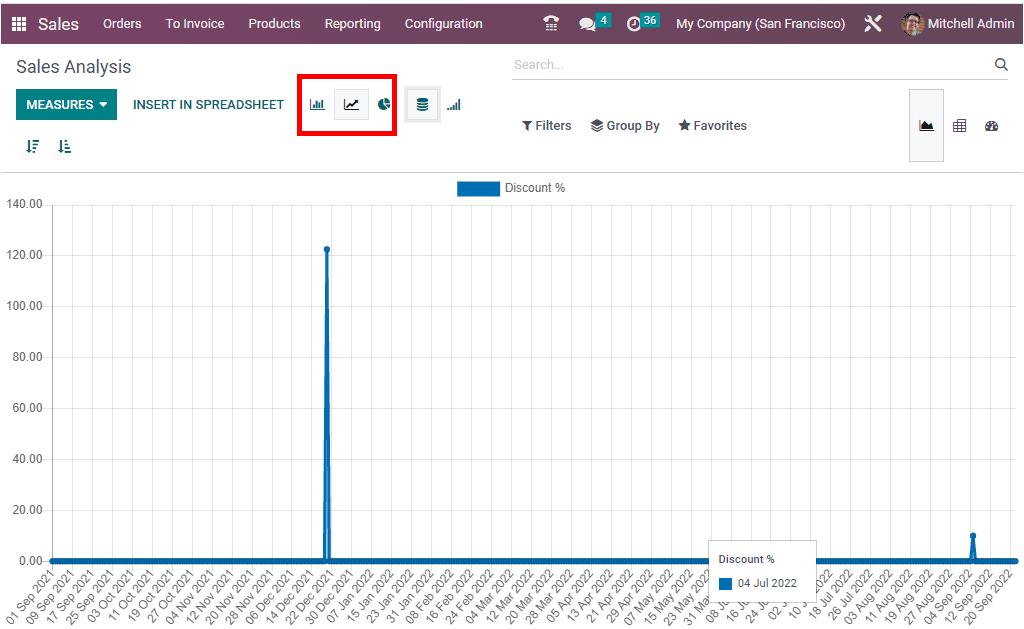
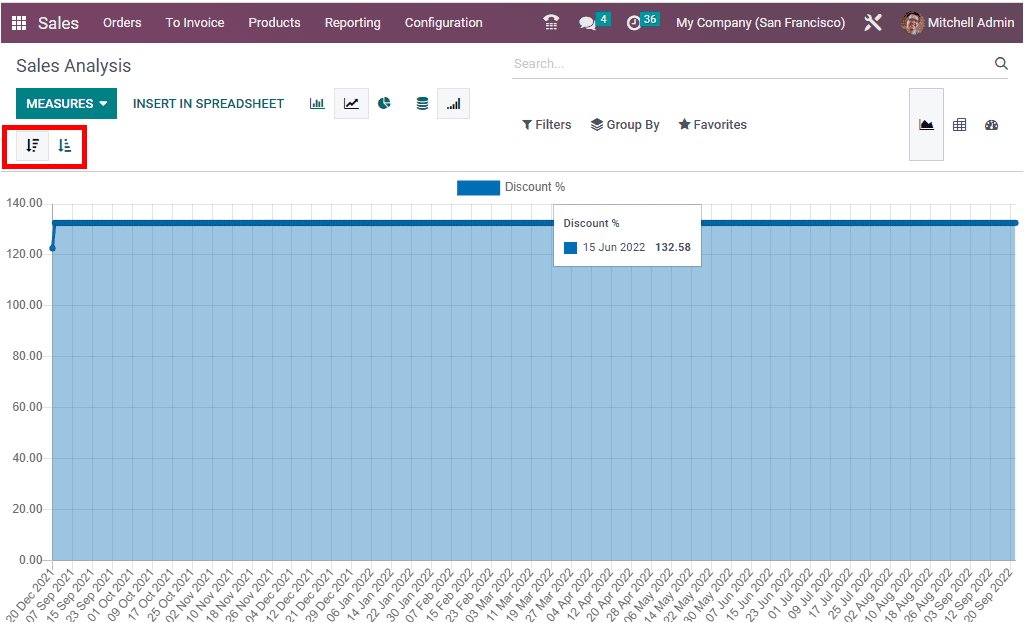
The graphical representation has further options to display the data in different forms such as Bar charts, Line charts, and Pie charts, which can be selected respectively from the options available on top of the window as shown in the image below.
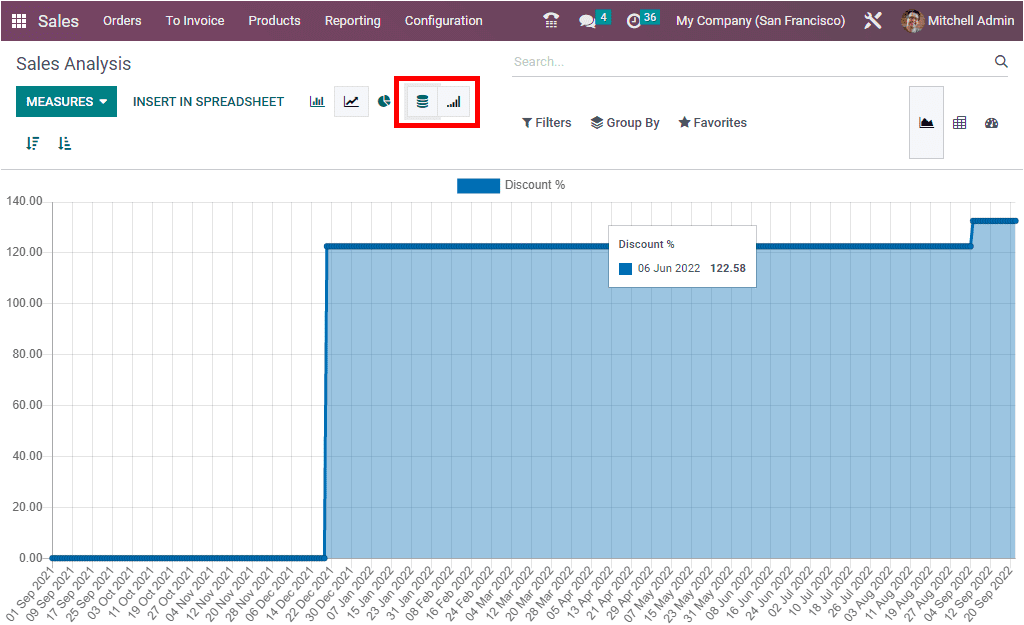
In addition to the above representations, the Stacked view and the Cumulative view are also available which can be accessed by clicking on the corresponding icons.
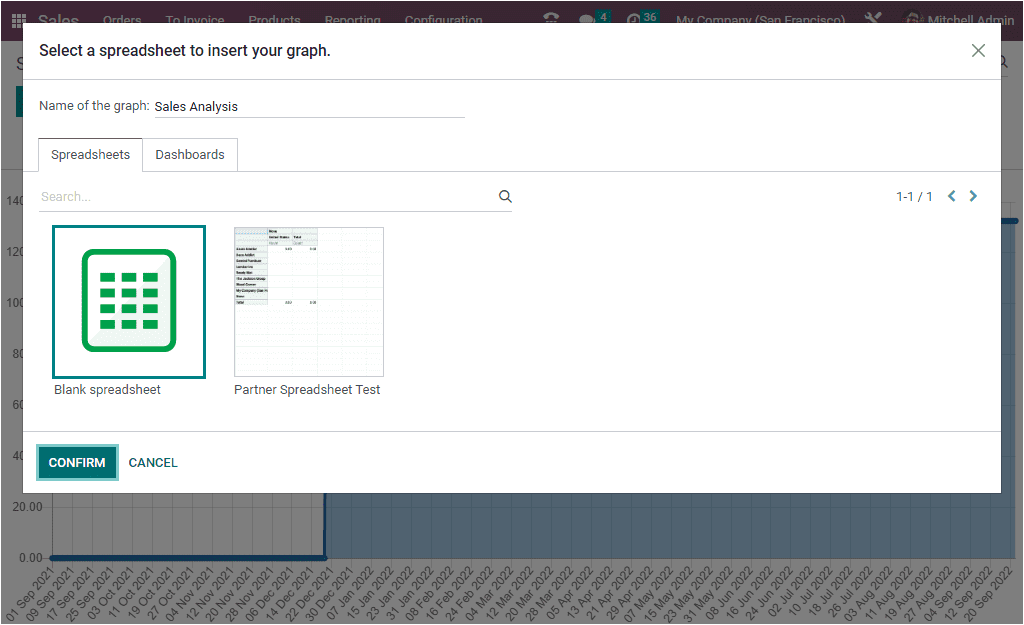
Odoo 16 has a very useful feature of allowing the users to create, change or insert the required data into a spreadsheet directly from the reporting view. In the Sales Analysis view, the button ‘INSERT TO SPREADHSEET’ will allow you to insert your graph into a spreadsheet. On clicking this button, a pop-up will be displayed which allows you to choose the required spreadsheet for the graph to be inserted into.
DOWNLOAD ERP
In addition to this, the reports can be arranged in ascending and descending modes by clicking on the respective options as shown in the image below.
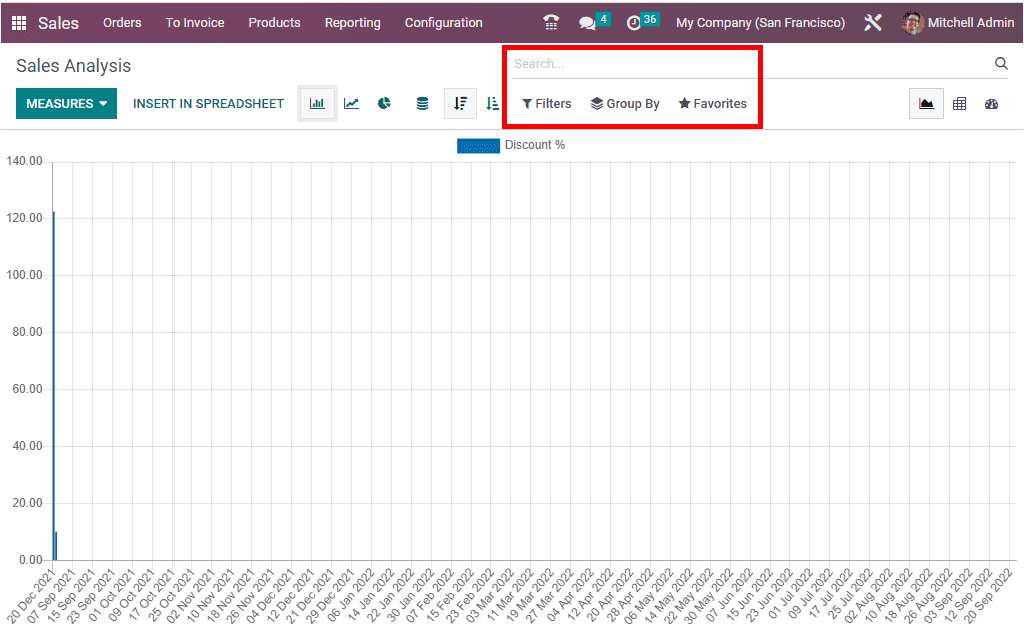
 In addition to all the above options, Odoo’s default functionalities such as Filters, Group By, and Search options are also available in this view.
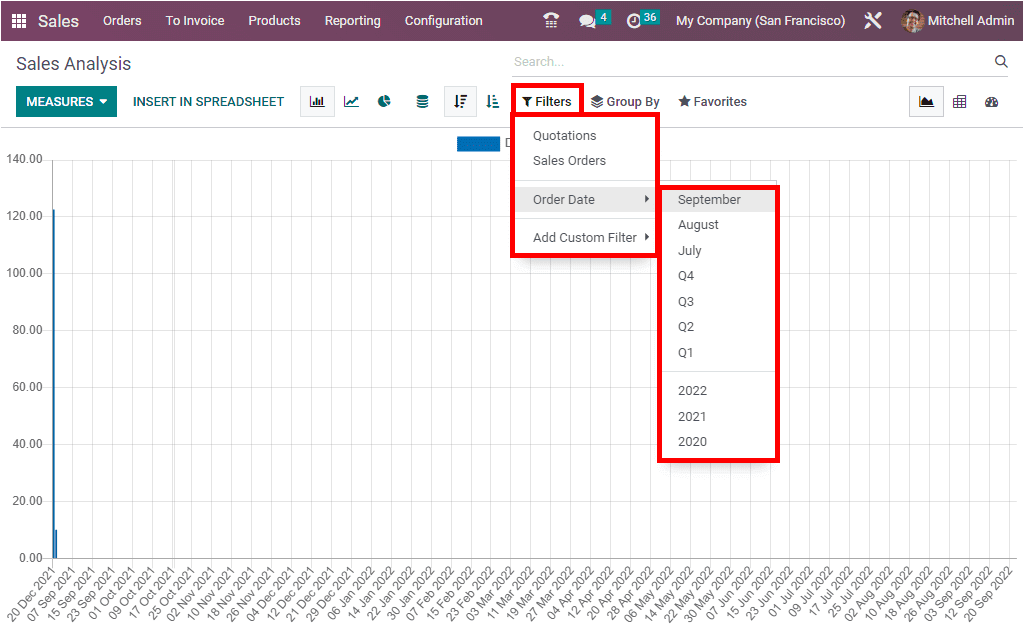
The Filters option will help you create reports regarding Quotations and Sales Orders. The ‘Filters’ tab will have some default options which include Quotations, Sale Orders, and the Order Date. The report can then be customized by changing the measures and adding Custom Filters as per the requirement. The filters can also generate daily, weekly, monthly, and yearly reports of sales and quotations.
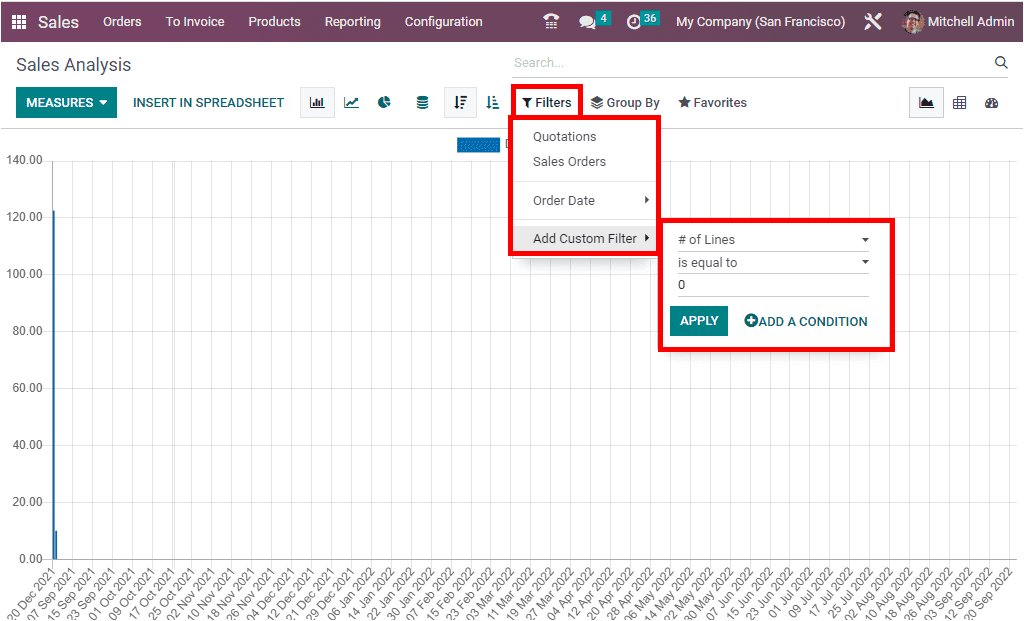
The Custom Filter option at the bottom of the filter menu gives the option to add and customize various filters which can then generate the report.
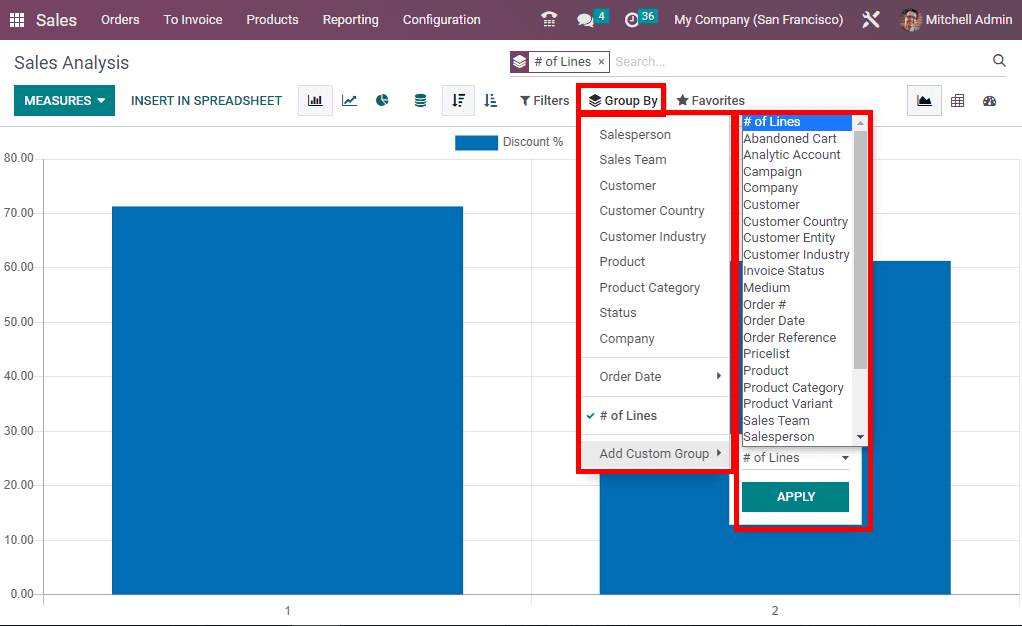
 The Group By option allows the grouping of the report data based on various criteria. The image below shows the default options available in the Group By option. The options include –
- Salesperson
- Sales Team
- Customer
- Customer Country
- Customer Industry
- Products
- Product Category
- Status
- Company
- Order Date (Year, Quarter, Month, Week, or Day).
You can also add custom groups by using the ‘Add Custom Group’ option.
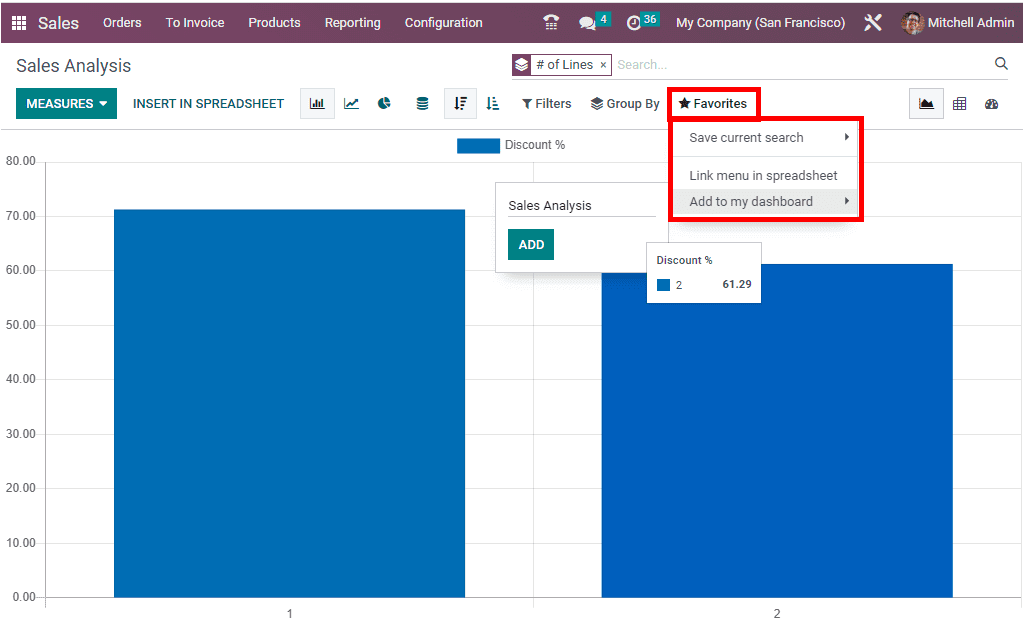
Similarly, the Favourites tab also gives various options such as Saving the current search, Linking the menu in a spreadsheet, and Adding to my dashboard, as shown in the image below.
 PIVOT VIEW
The pivot view of the Sales Analysis Report will make your data into a tabular format as shown in the image below.
 Here also we have the ‘MEASURES’ tab, which can be used as per the requirement.

All the options that we mentioned above in the MEASURES tab of the Graph view are also available in the Pivot view. In addition to this, you can see the options such as Flip Axis, Expand All, and Download XLSX available in the Pivot view.

The different sorting functionalities, namely Filters, Group By, Favourites, and Search options are also available in this view.
Apart from this, the pivot view also allows you to analyze the total amount based on various criteria such as –
- Salesperson
- Sales Team
- Customer
- Customer Country
- Customer Industry
- Product
- Product Category
- Status, Company
- Order Date( Year, Quarter, Month, Week, and Day)
 DASHBOARD VIEW
 DASHBOARD VIEW
The Dashboard view menu icon will navigate into the Dashboard view of the Sales analysis window as shown in the image below.

The Dashboard view window will display the reports in many report forms. Representations such as graphs, pivots, and quantitative measures are all available in this window.

The Dashboard window will display the Total Sales, Untaxed Total, Orders, Average Order, Number of Customers, and Number of Lines as shown in the above image. Also, the Conversion Rate is depicted as a Pie chart.
Thus with the help of Odoo’s Sales Module and its reporting features, you will manage and organize all the sale orders and quotations in a well-structured manner which will ultimately help in the growth of your business.
"Unlock the Full Potential of Your Business with Odoo ERP!"
"Get a Cost Estimate for Your ERP Project, Absolutely FREE!"
Get a Free Quote